Probability Squares
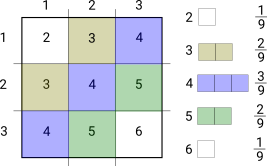
A geometric way to represent combining two independent discrete random variables is as a probability square. On each side of the square we have the distributions of the random variables, where the length of each segment is proportional to the probability. In the centre we have the function evaluated on the two edges and the probability is proportional to the area of the rectangle.
For example suppose we had a random process that generated 1, 2 or 3 with equal probability (for example half the value of a die, rounded up). If we want to calculate the probability distribution of adding the values of two results we can use the probability square. We can work out the relative areas just by counting the squares with the same value to create the distribution on the right.

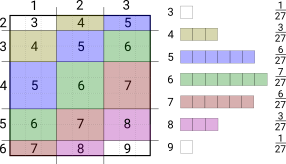
If you want to combine 3 (or more) such things conceptually it’s a cube (or hypercube) which you could flatten into slices. But it’s much easier to draw as 2 separate products; first combining two variables and then combining the result with the third. For example the distribution of adding three outcomes equally split between 1 and 3 can be obtained from the previous result.

Conceptually you can think of taking a sample from the product distribution as throwing a dart at the product square. If the variables were not independent the lines for each segment wouldn’t be straight; they would vary by segment. For a continuous variable you could cut up the cumulative distribution function on values of probability to estimate the product square; this is the kind of idea used in measure theory.
It’s not a very useful computational device, but it’s handy for thinking through the basics of probability.