Excel Binning
Putting numeric data into bins is a useful technique for summarising, especially for continuous data. This is what underlies histograms which is a bar chart of frequency counts in each bin. There are two main ways of doing this in Excel with groups and with vlookup (you can also do this in SQL).
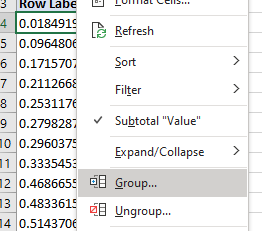
If you want equal length bins in a Pivot Table the easiest way is with groups. Right click on the column you want to bin and select Group
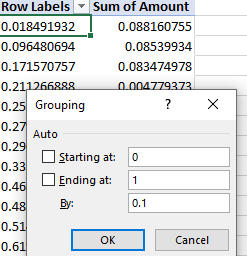
Then enter the start and end of the bin and the length of the bins.
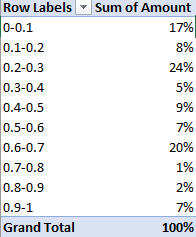
You then get a binned view in the pivot table.
What about if you want irregular size bins, or outside a pivot table? One way is with nested IF statements, but this is error prone and hard to maintain.
IF(B2 < 0.1, "0 - 0.1", IF(B2 < 0.3, "0.1 - 0.3", ...An easier way is to make a separate table for your bins that are ordered.
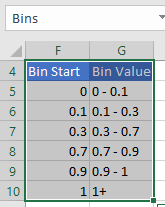
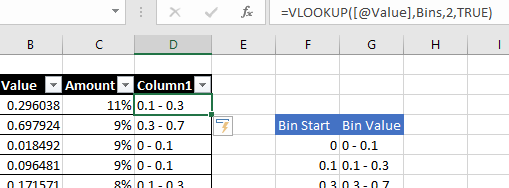
To get the labels I concatenated the values of the bin endpoints: =CONCAT(F5, " - ", F6). I also labelled the region as Bins (in the top left) to make it easy to refer to.
Then you can lookup the value with VLOOKUP. By default it does a RANGE lookup, returning the first row in the table where the value is at least Bin Start.
For example I used the formula =VLOOKUP([@Value],Bins,2,TRUE). The first argument is the value to lookup (here I used a column Value of a table, the second is the area we lookup from (the data range Bins), the third is the column number of the table to lookup the value from (here 2, the Bin Value) and finally if we want a range lookup (TRUE - that’s how the binning works).
So now you can count your data in custom bins and even plot a histogram over it. The only tricky thing is getting the right order for the bins in pivots/plots (since for example as strings “2” > “10”). I’m not sure if there’s a good way to do this in Excel (like an ordered factor in R).