Decorating Pandas Tables
When looking at Pandas dataframes in a Jupyter notebook it can be hard to find what you’re looking for in a big mess of numbers. Something that can help is formatting the numbers, making them shorter and using graphics to highlight points of interest. Using Pandas style you can make the story of your dataframe standout in a Jupyter notebook, and even export the styling to Excel.
The Pandas style documentation gives pretty clear examples of how to use it. When you have your final dataframe you can then call .style and chain styling functions.
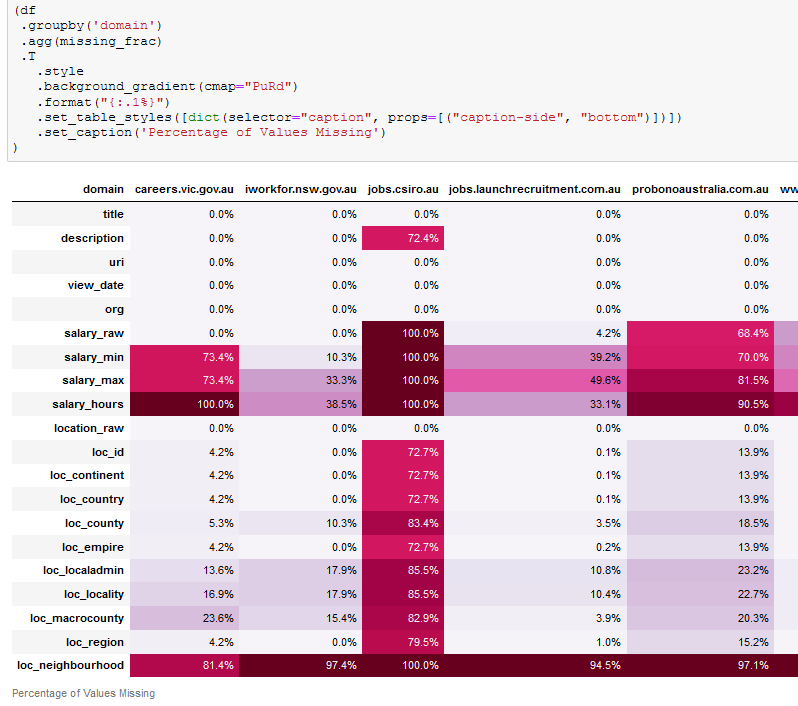
For example you can colour cells by their value using style.background_gradient to get an effect like Excel’s Colour Scales Conditional Formatting. You can choose a colormap through the cmap argument, using the Matplotlib colormaps. One handy trick is to get the reverse of a colormap by appending _r to the name.
(
 df
 .style
 .background_gradient(cmap="PuRd_r")
)
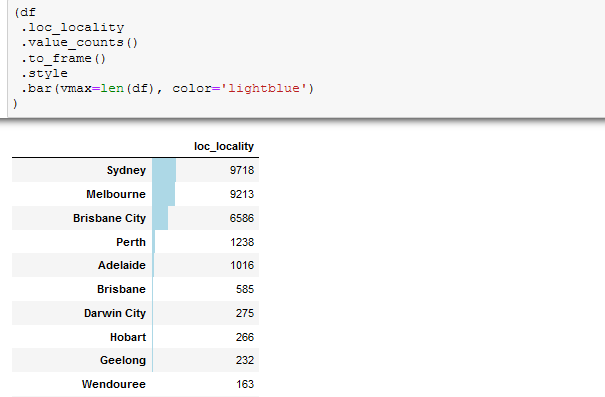
You can even make a data barchart inside the dataframe using style.bar. You can set the color, minimum and maximum values, axis and choose a subset of columns to show bars on.
(
 df
 .style
 .bar(vmax=len(df), color='lightblue')
)
To make the data easier to read you can add a style.format. This can take a dictionary of columns to formatters which can be format strings or functions. Because the HTML is rendered you can actually use this to do things like put in decorations.
def format_arrow_text(value):
    if value < 0:
        indicator = '<span style="color:red;">⮟</span> '
    elif value > 0:
        indicator = '<span style="color:green;">⮝</span> '
    else:
        indicator = ''
    return f'{indicator} {value:.1%}'

df.style.format(format_arrow_text)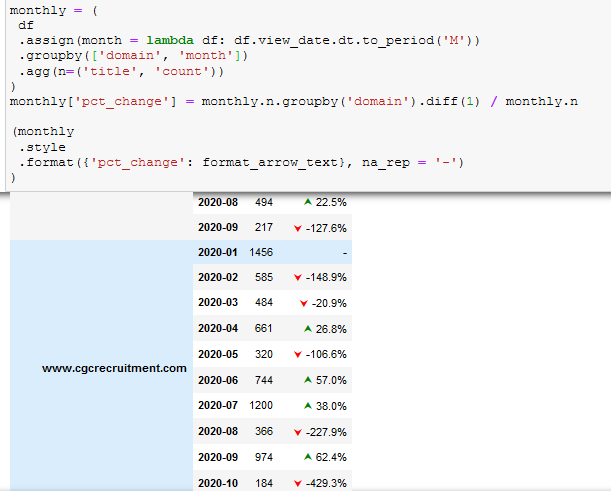
This is just scratching the surface, you can do a lot more by writing custom styles. It’s convenient for simple things but styling with just CSS attributes at a cell level is a bit clunky, and for complex things you’ll want to render your own HTML (potentially by subclassing).
For contrast R has the formattable package which can achieve many of the same things. In this case the syntax isn’t much better than Pandas.